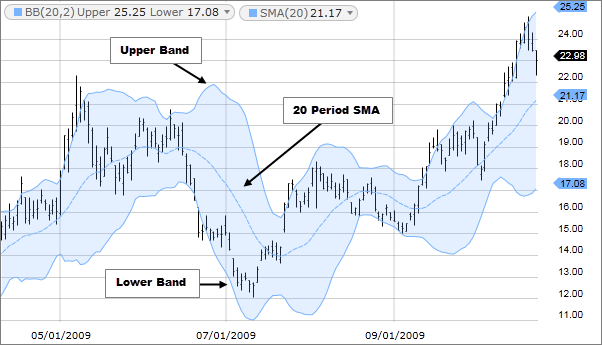
What it is and what it shows
Bollinger Bands consist of three lines:
- Middle Band – A simple moving average (typically a 20-period SMA)
- Upper Band – Middle band + (multiplier x standard deviation)
- Lower Band – Middle band – (multiplier x standard deviation)
Standard settings involve a 20-day period with a 2 standard deviation multiplier, but these can be adjusted based on the asset and timeframe being traded.
The key features of Bollinger Bands are the spacing between the bands and their relative position to the current price. When the bands contract, it can indicate a period of low volatility, often referred to as the “squeeze.” When they expand, it suggests increased volatility.
How to trade it
There are several strategies and signals that traders use with Bollinger Bands:
- Bollinger Bounce: One of the most common strategies is the ‘Bollinger Bounce’, which capitalizes on the nature of the bands to act as support and resistance levels. Prices tend to bounce back from the outer bands.
- Bollinger Squeeze: A squeeze denotes a period of low volatility and is considered by traders as a potential indicator of future increased volatility and possible trading opportunities.
- Riding the Bands: In a strong uptrend, price might ride the upper band, and during a downtrend, it might ride the lower band. This can be a signal that the current trend is strong and might continue.
- Bollinger Band Breakouts: Traders might buy or sell securities when the price breaks and closes outside of the bands.
Example: If a stock’s price touches the lower band and begins to turn upward, traders might consider it as a buying opportunity, expecting the price to bounce back toward the middle band.
Example: If the bands squeeze together tightly, it could be an indication that a breakout, either upward or downward, might be imminent.
Example: If a currency pair in a forex market is riding the upper Bollinger Band and the indicators are showing the pair is not overbought, a trader might stay long, expecting the pair to continue its upward momentum.
Example: If a stock’s price closes above the upper Bollinger Band, some traders might view this as a sign to sell, anticipating a pullback toward the middle band. Conversely, a close below the lower band might prompt a buy order.
When utilizing Bollinger Bands, it’s always recommended to use them in conjunction with other technical indicators or methods to confirm signals and make more informed trading decisions.