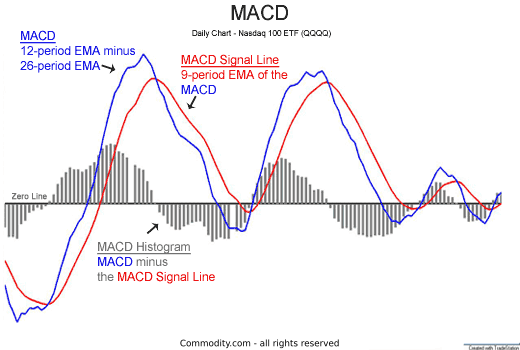
What it is and what it shows
MACD is computed by subtracting the 26-period Exponential Moving Average (EMA) from the 12-period EMA. The result of that calculation creates the MACD line. A 9-day EMA of the MACD, called the “signal line,” is then plotted on top of the MACD line, which can act as a trigger for buy and sell signals.
MACD indicators typically have a histogram. The histogram shows the difference between the MACD line and the signal line. When the MACD is above its signal line, the histogram will be above the MACD’s baseline (positive). Conversely, when the MACD is below its signal line, the histogram will be below the MACD’s baseline (negative).
In essence, MACD does the following:
- Indicates momentum: The closer MACD moves to zero line, the closer the 12-period and 26-period EMAs are.
- Shows trend direction: When the MACD is above zero, the short-term average is above the long-term average, indicating upward momentum. Conversely, when it’s below zero, it indicates downward momentum.
- Identifies duration of momentum: If MACD is far away from the zero line, momentum is high. When it’s close, momentum is low.
How to trade it
There are various ways traders use MACD for making trading decisions:
- Crossovers: This is the most common MACD signal. A bullish crossover occurs when the MACD line crosses above the signal line. A bearish crossover happens when the MACD line crosses below the signal line. Crossovers can be used as a buy or sell signal.
- Overbought/Oversold Conditions: Even though MACD isn’t bound to an upper or lower limit, traders often use it to identify overextended price moves. If MACD has risen significantly and is well above zero, the asset might be overbought. Conversely, a significant drop below zero can indicate an oversold condition.
- Divergence: When the asset’s price diverges from MACD, it can be an end-of-trend warning. A bullish divergence forms when the asset records a lower low, but the MACD forms a higher low. This can suggest less downward momentum. A bearish divergence is the opposite, indicating weakening upward momentum.
- Zero-Line Crossovers: MACD’s zero line often acts as a support and resistance level. A bullish centerline crossover occurs when MACD moves above zero and into positive territory. This signals that the 12-day EMA has crossed above the 26-day EMA. A bearish centerline crossover occurs when MACD moves below zero.
Example: If MACD crosses above the signal line, some traders might consider buying the asset. If it crosses below, they might consider selling.
Example: If a stock’s price makes a new high, but MACD doesn’t reach its previous high, this could be a sign of potential bearish reversal.
It’s crucial to remember that while MACD can be a potent tool, no indicator is foolproof. It’s always recommended to combine MACD with other forms of technical analysis to make well-informed trading decisions.

