TRIX Indicator
TRIX is a momentum-based oscillator derived from the triple-smoothed exponential moving average of a security’s price. It was developed in the early 1980s by Jack Hutson, editor of Technical Analysis of Stocks and Commodities magazine. The main purpose of TRIX is to filter out market noise and highlight significant trends.
What it is and what it shows
The TRIX oscillates around a zero line. Its movement is similar to the Moving Average Convergence Divergence (MACD), but the method of calculation differs.
What it is and what it shows
The TRIX oscillates around a zero line. Its movement is similar to the Moving Average Convergence Divergence (MACD), but the method of calculation differs.
To compute TRIX:
- Calculate the 14-day exponential moving average (EMA) of the closing price.
- Calculate the EMA of the EMA just obtained.
- Calculate the EMA of the EMA obtained in the previous step.
- From the value obtained in the third EMA, subtract the previous day’s value to get the 1-day rate-of-change. This gives the TRIX value.
A signal line, which is a 9-day EMA of the TRIX, can also be plotted.
TRIX values above zero typically indicate bullish momentum, while values below zero suggest bearish momentum. A change in the direction of TRIX can be used to identify potential reversals in the price trend. The divergence between TRIX and price can also be a strong signal, similar to other momentum oscillators.
How to trade it
- Signal Line Crossovers: Just like the MACD, traders often look for signal line crossovers. A bullish signal is given when TRIX crosses above its signal line, and a bearish signal is given when it crosses below.
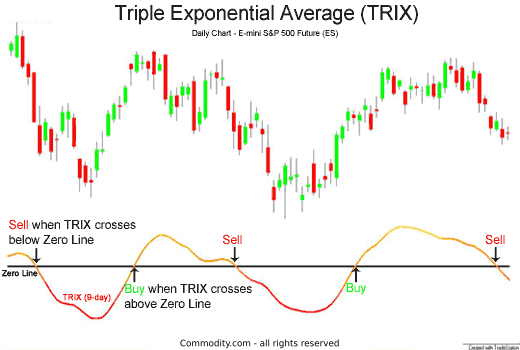
- Zero Line Crossovers: A buy signal is generated when TRIX crosses above the zero line, indicating a change from net negative to net positive momentum. Conversely, a sell signal is produced when TRIX crosses below the zero line.
- Divergences: Divergences between price and TRIX can signal potential trend reversals. If the price is making higher highs, but TRIX is making lower highs, this bearish divergence could be an early sign of an upcoming reversal. Similarly, bullish divergence can indicate a potential upward reversal.
Example: If TRIX rises from -0.5 to 0.3 and crosses above its signal line during this movement, this may be considered a bullish signal.

An example of the TRIX Indicator
The TRIX indicator is a versatile tool that can be beneficial for momentum and trend-following traders. By filtering out minor price fluctuations and highlighting more significant trends, TRIX provides a clearer picture of a security’s overall momentum. As with all indicators, TRIX should be used in conjunction with other technical analysis tools to confirm signals and improve overall trading accuracy.
