
Supertrend Indicator
The Super Trend Indicator (STI) is a versatile and widely-used tool in the realm of technical analysis. Designed to capture the essence of a prevailing trend, the STI assists traders in determining the primary direction of the market, helping them make more informed decisions about their trades.
What it is and what it shows
The Super Trend Indicator, typically visualized as a line on a chart, works by utilizing the Average True Range (ATR) in its calculations, and it adjusts itself based on the volatility of the underlying asset.
What it is and what it shows
The Super Trend Indicator, typically visualized as a line on a chart, works by utilizing the Average True Range (ATR) in its calculations, and it adjusts itself based on the volatility of the underlying asset.
Key features of the Super Trend Indicator:
- Directional Clarity: The STI provides clear buy and sell signals. When the price is above the Super Trend line and the line is green, it indicates a bullish trend. Conversely, when the price is below the line and the line is red, it suggests a bearish trend.
- Adaptable to Volatility: By using the ATR in its formulation, the Super Trend Indicator is sensitive to price volatility, allowing it to adjust dynamically.
- Simplicity: One of the primary appeals of the STI is its simplicity. It offers a straightforward visualization of the trend without the complexity of some other indicators.
How to trade it
When utilizing the Super Trend Indicator, consider the following guidelines:
- Entry Points: A buy signal is generated when the Super Trend line turns green and is positioned below the price. A sell signal arises when the line turns red and is above the price.
- Exit Points: Traders may consider closing their positions when the STI changes color, signaling a potential reversal in trend.
- Stop Loss: The Super Trend line can be used as a stop loss level. For a long position, a trader can set the stop loss just below the Super Trend line. For a short position, the stop loss can be set just above it.
- Combining with Other Indicators: To increase the reliability of the signals, combine the STI with other technical indicators like moving averages or momentum oscillators.
For example, in a chart where the STI turns from red to green and moves below the price, traders might consider this a favorable point to enter a long position. If used alongside a momentum oscillator that shows an overbought condition, traders might proceed with caution or wait for further confirmation.
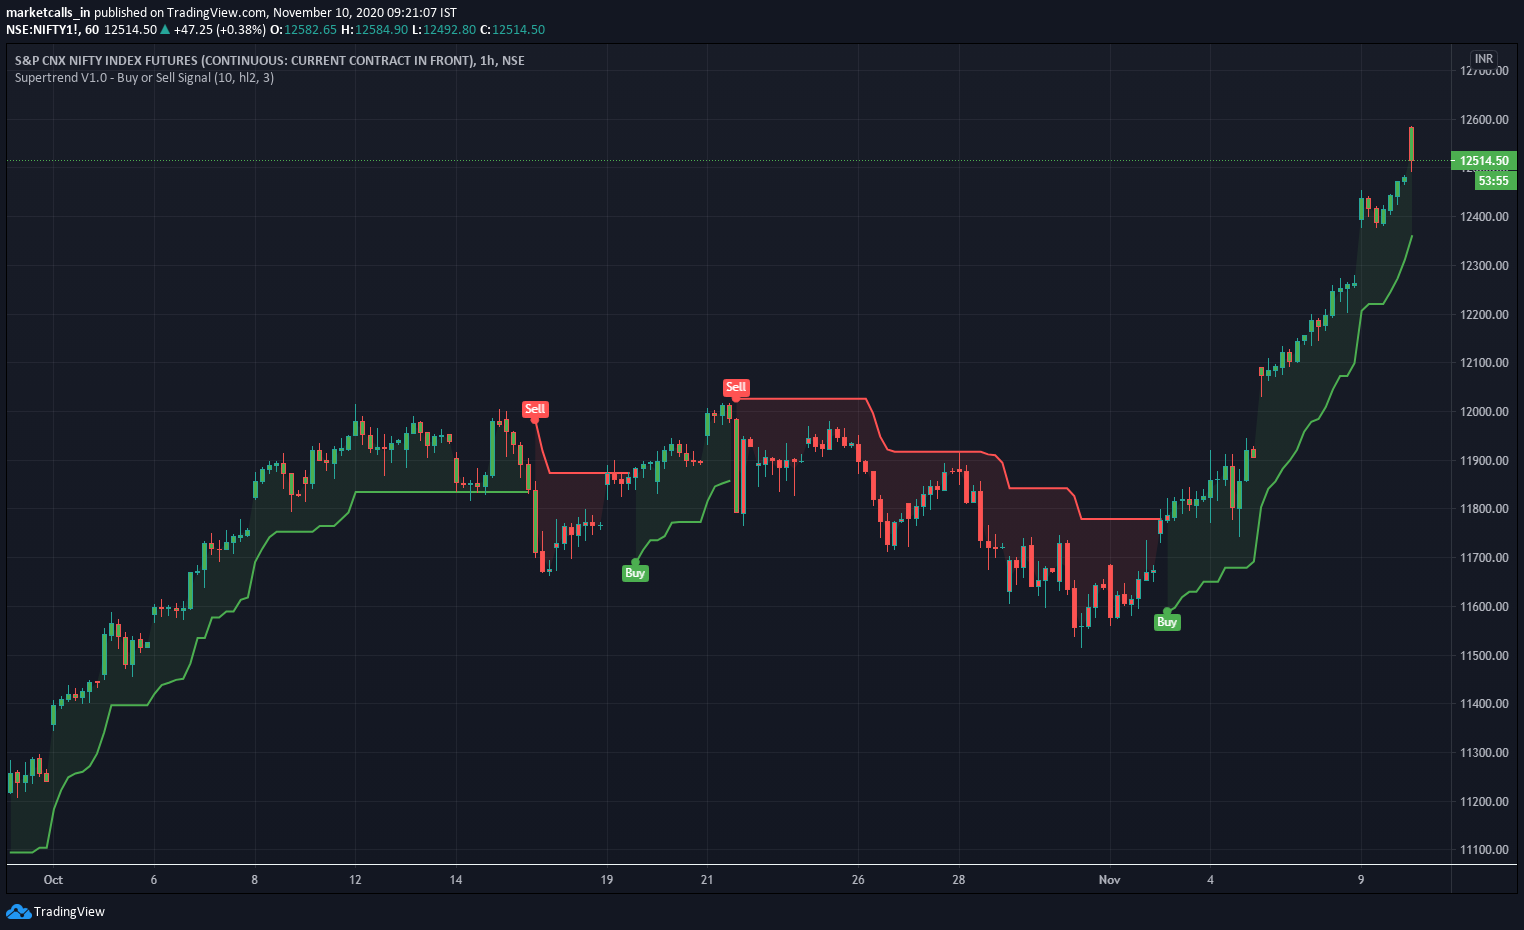
An example of the Supertrend Indicator
The Super Trend Indicator offers traders an uncomplicated yet effective means to gauge the prevailing market trend. Its adaptability to volatility ensures its relevance across different market conditions. As with all technical tools, the STI is most effective when used in conjunction with other indicators and a well-thought-out trading strategy. By understanding its signals and limitations, traders can incorporate the STI into their toolkit to navigate the markets with greater confidence.